

Tauc plot
Q: Is it a good idea to use a Tauc plot to determine the band gap of a semiconductor?
A: No.
If you are considering to use a so-called Tauc plot (sometimes referred to as Tauc's method) to determine a band gap value, please think about the following very brief points:
First, what is a Tauc plot? A Tauc plot is a graph, often times used to determine the optical band gap of a semiconductor by plotting (α hν)n (α - absorption coefficient) versus the photon energy hν. n is chosen based on the expected transition (direct, indirect, allowed, forbidden) and could be 2, 1/2, 2/3 or similar.
Sometimes also (α d)n with the layer thickness d is used as seen below. The idea is that this will lead to a 'linear region' which than can be extrapolated to the energy axis to determine the optical band gap. The method has several problems which will be discussed in the following.

Problem 1: Excitons and broadening
The original work auf Jan Tauc can be found here: J. Tauc, Optical properties and electronic structure of amorphous Ge and Si, Materials Research Bulletin 3, 37 (1968). Already from the title it is clear that Tauc proposed the method for amorphous materials. He tackled the specific problem of low conductivity despite large and delocalized wave functions.
If instead you are working on crystalline semiconductors, please consider an optical interband absorption process: An electron from the valence band is "lifted" into the conduction band, leaving a hole behind. In the final state, we therefore are concerned with an electron-hole pair. These two quasi-particles are charged oppositely and thus are attracted by Coulomb interaction. This very simple physical fact remains true even if the absorption process was taking place at a photon energy much higher than the band gap energy. However, a Tauc plot just takes into account the pure density of states, i.e. the form of conduction and valence band but ignores the Coulomb interaction.
The interaction strength between electron and hole is called exciton binding energy and we can calculate different model spectra for different exciton binding energies. We use a broadened Elliott model: R.J. Elliott, Intensity of Optical Absorption by Excitons, Phys. Rev. 108, 1384 (1957). The image shows the imaginary parts of the dielectric function (proportional to the absorption coefficient) for a model semiconductor with certain parameters. The band gap is fixed to EG = 3.5 eV and the broadening parameter to 30 meV, the exciton binding energy EbX however is varied between 1 meV and 100 meV as given in the image:

We see, that the shape of the absorption onset varies drastically with the choice of EbX. In the next step, we create Tauc plots from these spectra.

Please consider now analyzing these Tauc plots by the usual extrapolation of the linear parts. Obviously, the true value of EG = 3.5 eV can never be obtained due to the existence of EbX and broadening.
Problem 2: α from Transmission measurements
The absorption coefficient α used in a Tauc plot is often derived from a simple transmission measurement T by
α=(1/d)*ln(1/T)
without taking into account the not negligible influence of reflectance. A more accurate α can be determined by also measuring the Reflectence R
α=(1/d)*ln((1-R)2/T)
But a proper determination of α could, for example, also be achieved by measuring the full dielectric function ε by spectroscopic ellipsometry:
α=(ω*ε2)/(c0*n) with n2=0.5*(sqrt(ε12+ε22)+ε1)
Problem 3: The 'linear' region
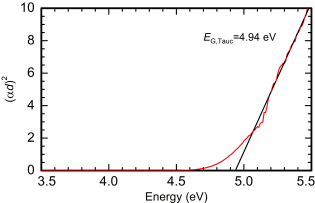
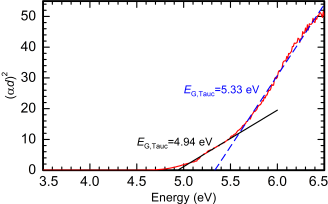
To determine the bandgap from a Tauc plot, a certain region of the graph is identified as the linear region which is then extrapolated to the energy axis. The main problem with this approach is that the choice of the linear region is often quite arbitrary, and it strongly influences the results. In most crystalline semiconductors you will find that there is not a region whatsoever that could even remotely be described as linear. Often in the literature the region that looks the 'most linear' is chosen, but that does not meet scientific standards. Also, depending on the energy range of the Tauc plot under consideration there may be several linear regions as can be seen in the example of κ-(InGa)2O3 below.
The left figure shows a Tauc plot up to 5.5 eV. The choice of the linear region seems obvious. The right figure shows the same spectra with an increased range up to 6.5 eV. Now there is an additional region which could be the linear one. But which one is the real band gap? There is no right answer, as the method is simply not applicable.
Problem 4: Anisotropy
The last point worth mentioning in this discussion is the problem of anisotropy. When performing transmission measurements under normal incidence to gain an absorption coefficient to then determine a Tauc band gap, the anisotropy of the crystal structure is ignored in pretty much all of the literature.
But, in any non cubic crystal structure, an optical anisotropy is expected. Thus at least two different absorption coefficients along the different crystal planes exist.
If derived out of the dielectric function by spectroscopic ellipsometry as proposed in 'Problem 3', all elements of the full dielectric tensor can be determined by several measurements while rotating the sample in-between. Thus, different absorption coefficients and from them different optical band gaps depending on the crystal orientation can be derived. An example where this is performed by our group in an orthorhombic system (3 different absorption coefficients) can be found here: Kluth et al., Absorption Anisotropy of Orthorhombic Single-Domain κ-Ga2O3 from Infrared to Ultraviolet: Phonons and Bandgaps, Editor's Pick, Appl. Phys. Lett. 127, 172106 (2025).
Further Reading
There are more limitations to the Tauc plot. A very extensive recent discussion can be found here: J. Klein et al., Limitations of the Tauc Plot Method, Adv. Funct. Mater.33, 2304523 (2023).
An additional one here: A. Zanatta, Revisiting the optical bandgap of semiconductors and the proposal of a unified methodology to its determination, Scientific Reports 9, 11225 (2019).
A very nice publication dealing with one specific example is: A. Segura et al., Current underestimation of the optical gap and Burstein-Moss shift in CdO thin films: A consequence of extended misuse of α2-versus-hν plots, Appl. Phys. Lett. 99, 151907 (2011).
So, please do not use Tauc's method to determine band gap values for semiconductors as the method is simply not applicable.
(This page is still work in progress and will be improved. Current version: 2)